Agent tracing: how to trace and debug AI agents in production
Production agent failures are difficult to debug when logs only show the final response. An incorrect answer may result from poor retrieval, a tool error, a missing state update, or a model call that received the wrong input, and the final output rarely shows which step caused the failure.
Agent tracing records the full execution path of a single agent run as connected spans. Each span captures the inputs, outputs, timing, tool calls, retrievals, model calls, and state changes needed to identify the failing step, rather than rerunning the agent and hoping the issue appears again.
This guide explains what agent tracing captures, how agent traces differ from LLM tracing and logging, how to instrument agents with Braintrust, and how to turn a failing production trace into a regression eval that prevents the same failure from reaching production again.
Why agent failures are invisible in production
A support agent answers a refund question with confidence, but the answer is wrong. The production log shows only the final response, which says the order was non-refundable. The log does not show that the order-lookup tool succeeded, the retrieval step returned an outdated policy document, and the model reasoned from incorrect context. The model call may have behaved as expected, while the retrieval step caused the failure.
Production agents are difficult to debug because a single run typically involves multiple model calls, tool calls, retrievals, and state changes. Any step can introduce an error, but a flat log leaves every step disconnected from the next. Teams often end up rerunning the agent locally, adding print statements, and trying to reproduce a failure that may depend on live data, timing, or user context.
Agent tracing records the full execution path of each run. Instead of a single log line, you get the steps the agent executed in order, along with the inputs and outputs for each step. The wrong refund answer becomes a specific finding because the retrieval step returned an outdated policy document. That level of visibility is why agent tracing is the foundation for tools that debug agent failures.
What agent tracing captures
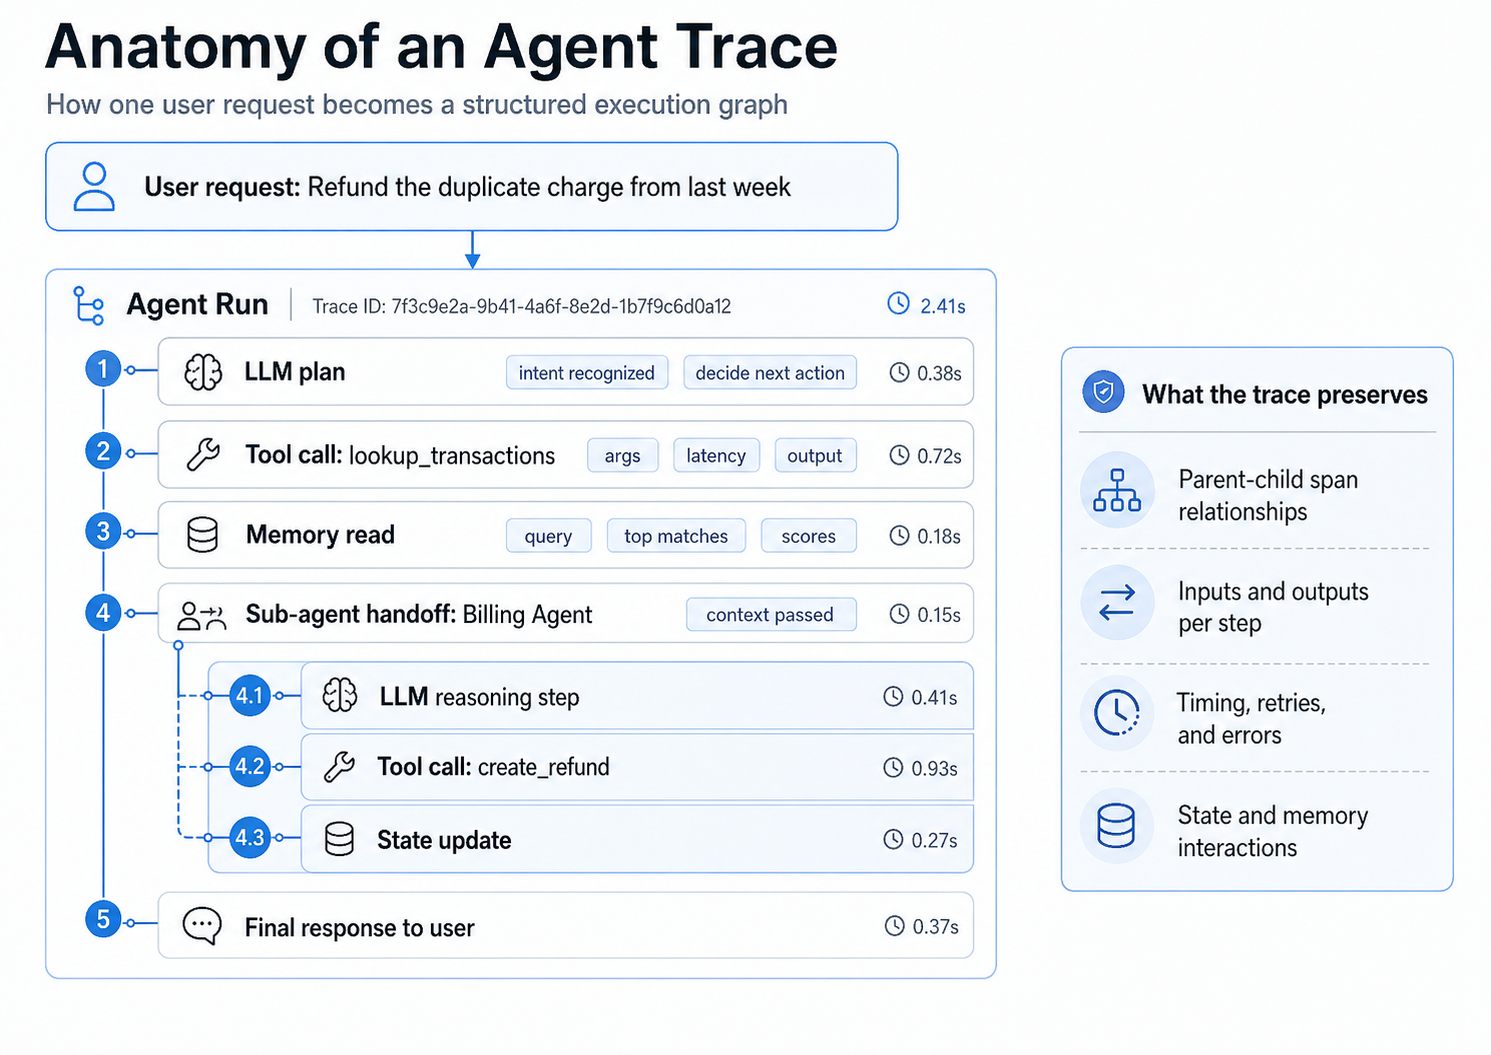
A structured trace shows how one user request moves through the agent run, including model calls, tool calls, memory reads, sub-agent handoffs, state updates, and the final response.
Agent tracing breaks a run into connected spans. Each span records one unit of work, including the input it received, the output it returned, and the time it took. Because spans are nested in execution order, the trace shows how the agent moved through model calls, tool calls, retrieval steps, memory reads, state updates, and handoffs before producing an answer.
For a production failure, the most useful trace data is the sequence of inputs, decisions, and intermediate outputs that led to the final response.
Inputs and outputs: Each span preserves the prompt, arguments, context, or payload sent into a step, along with the result returned by that step.
Tool and model calls: Separate spans show which tool ran, which model was invoked, and which parameters were used, so you can inspect the operation that shaped the run.
Retrievals: Retrieval spans show the query issued, the documents returned, and the context passed forward to the model, which helps isolate failures caused by outdated, irrelevant, or incomplete retrieval results.
Latency and token cost: Timing and token data show where the run slowed down or became expensive, so performance and cost issues point to a specific span rather than the whole request.
State transitions and reasoning steps: State updates, memory reads, sub-agent handoffs, and reasoning steps show how the agent moved from one decision to the next before generating the final response.
For a deeper walkthrough of the trace structure, see Braintrust's guide on how to read a trace.
Agent tracing vs. LLM tracing vs. logging
Logging, LLM tracing, and agent tracing answer different debugging questions, so the right scope depends on how much of the agent run you need to inspect.
| Dimension | Logging | LLM tracing | Agent tracing |
|---|---|---|---|
| Primary debugging question | What happened, when did it happen, and was an error recorded? | What prompt was sent to the model, and what response came back? | Which step in the agent run caused the failure? |
| Primary unit | A discrete event, error, metric, or status message. | One model call, including the prompt, response, token usage, and model metadata. | One full agent run, including model calls, tool calls, retrievals, state changes, and handoffs. |
| Structure | Flat records searched by timestamp, request ID, severity level, or custom fields. | A single span or small group of spans around a model invocation. | A parent-child span tree that mirrors the agent's execution path. |
| Step relationships | Logs can share IDs, but they do not automatically show how one step caused the next. | The model input and output are connected, but surrounding tool and retrieval steps may sit outside the trace. | Each span is connected to the run, so the trace shows how earlier steps shaped later decisions. |
| Model visibility | Model inputs and outputs appear only when developers log them explicitly. | Prompts, responses, model settings, token usage, and timing are captured for the model call. | Model calls are captured as part of the broader agent execution path. |
| Tool call visibility | Tool calls appear only when the application logs them explicitly. | Tool execution is not fully visible unless tool calls are instrumented separately. | Tool calls appear as spans with arguments, outputs, timing, and errors. |
| Retrieval visibility | Retrieval queries and returned documents appear only when logged manually. | Retrieved context may appear in the prompt, but the retrieval query and document selection process are usually outside the model trace. | Retrieval spans show the query, returned documents, and context passed forward to the model. |
| State and memory visibility | State changes and memory reads are usually implicit unless developers add custom logs. | Model-call tracing does not show how agent state changed across the run. | State updates, memory reads, and intermediate decisions can be captured as spans. |
| Multi-agent handoffs | Handoffs are difficult to reconstruct from flat logs. | Handoffs are outside the model-call boundary unless instrumented separately. | Handoffs can nest under the parent run, which makes multi-agent execution easier to inspect. |
| Latency and cost analysis | Logs can show total latency or custom timing, but attribution depends on manual instrumentation. | Latency and token cost are visible for the model call. | Latency and token cost are visible by span, so slow or expensive behavior can be tied to a specific step. |
| Best fit | Error tracking, counters, infrastructure signals, and operational event records. | Prompt review, model behavior analysis, and token usage inspection for individual calls. | Debugging production agents, reviewing tool and retrieval behavior, and creating evaluation cases from real failures. |
| Main limitation | Logs help detect events, but they do not reconstruct the agent's decision path. | LLM tracing is useful for model-level review, but it can miss failures caused by retrieval, tools, state, or handoffs. | Agent tracing needs instrumentation across the parts of the agent you want to inspect. |
| Relationship to agent observability | Logging supplies event-level signals for dashboards and alerts. | LLM tracing supplies model-level evidence for prompt and response analysis. | Agent tracing supplies the execution data that agent observability uses to explain failures across complete runs. |
How to instrument agent tracing with Braintrust
Instrumenting an agent means recording the agent's execution steps as spans. In Braintrust, you can start with auto-instrumentation for supported frameworks, then add manual spans for custom logic that the framework cannot see, such as retrieval functions, business rules, or data transformation steps.
Start with auto-instrumentation
Auto-instrumentation is the fastest way to capture common agent activity. Braintrust integrations can record model calls, tool calls, framework steps, and agent runs with minimal code, which gives you structured traces before you add custom spans.
OpenAI Agents SDK: Register Braintrust as a trace processor so agent runs, tool calls, and model calls are captured automatically.
import asyncio
import os

import braintrust

braintrust.auto_instrument()
braintrust.init_logger(
    api_key=os.environ["BRAINTRUST_API_KEY"],
    project="openai-agents-example",  # Replace with your project name
)

from agents import Agent, Runner


async def main():
    agent = Agent(
        name="Assistant",
        model="gpt-5-mini",
        instructions="You answer in one sentence.",
    )
    result = await Runner.run(agent, "What is the capital of France?")
    print(result.final_output)


if __name__ == "__main__":
    asyncio.run(main())
LangGraph: Set a global LangChain callback handler once so graph operations are traced as the agent moves through the workflow.
import {
  BraintrustCallbackHandler,
  setGlobalHandler,
} from "@braintrust/langchain-js";


const logger = initLogger({
  projectName: "My Project",
  apiKey: process.env.BRAINTRUST_API_KEY,
});

const handler = new BraintrustCallbackHandler({ logger });
setGlobalHandler(handler);

const StateAnnotation = Annotation.Root({
  message: Annotation(),
});

const model = new ChatOpenAI({
  model: "gpt-5-mini",
});

async function sayHello(_state: typeof StateAnnotation.State) {
  const res = await model.invoke("Say hello");
  return { message: res.content };
}

function sayBye(_state: typeof StateAnnotation.State) {
  console.log("From the 'sayBye' node: Bye world!");
  return {};
}

async function main() {
  const graphBuilder = new StateGraph(StateAnnotation)
    .addNode("sayHello", sayHello)
    .addNode("sayBye", sayBye)
    .addEdge(START, "sayHello")
    .addEdge("sayHello", "sayBye")
    .addEdge("sayBye", END);

  const helloWorldGraph = graphBuilder.compile();
  await helloWorldGraph.invoke({});
}

main();
Mastra: Initialize the logger and exporter so Braintrust can trace TypeScript agent runs, workflows, steps, tool calls, and model calls.
const logger = initLogger({ projectName: "mastra-demo" });

const exporter = new BraintrustExporter({
  braintrustLogger: logger,
});

const mastra = new Mastra({
  agents: {
    assistant: new Agent({
      name: "Assistant",
      instructions: "You only respond in haikus.",
      model: "openai/gpt-5-mini",
    }),
  },
  observability: new Observability({
    configs: {
      braintrust: {
        serviceName: "demo",
        exporters: [exporter],
      },
    },
  }),
});

async function main() {
  const agent = mastra.getAgent("assistant");
  const response = await agent.generate(
    "Tell me about recursion in programming.",
  );
  console.log(response.text);
}

main();
Add manual spans for custom logic
Framework instrumentation covers the standard agent path, but production agents often include custom functions outside the framework. In the TypeScript SDK, wrapTraced turns a function into a traced span. When one traced function calls another, Braintrust nests the spans automatically, which creates the parent-child structure used during debugging.
const logger = initLogger({ projectName: "My Project" });

const fetchData = wrapTraced(async function fetchData(query: string) {
  // Database query logic
  return await db.query(query);
});

const transformData = wrapTraced(async function transformData(data: any[]) {
  // Data transformation logic
  return data.map((item) => transform(item));
});

// Parent span containing child spans
const pipeline = wrapTraced(async function pipeline(input: string) {
  const data = await fetchData(input); // Child span 1
  const transformed = await transformData(data); // Child span 2
  return transformed;
});

// Creates a trace with nested spans:
// pipeline
// └─ fetchData
// └─ transformData
await pipeline("user query");
The resulting trace shows pipeline as the parent span, with fetchData and transformData nested underneath it as child spans.
Export existing OpenTelemetry spans
If your application already uses OpenTelemetry, you do not need to replace the existing instrumentation. The BraintrustSpanProcessor converts OpenTelemetry spans into Braintrust traces, so Braintrust can receive span data alongside the rest of your observability setup.
OTel setup needs an API key and a parent project or experiment so spans route to the right place. Set these environment variables before running the code below:
BRAINTRUST_API_KEY=your-api-key
BRAINTRUST_PARENT=project_name:my-otel-project
import os

from braintrust.otel import BraintrustSpanProcessor
from opentelemetry import trace
from opentelemetry.sdk.trace import TracerProvider

# Configure the global OTel tracer provider
provider = TracerProvider()
trace.set_tracer_provider(provider)

# Send spans to Braintrust. `parent` defaults to the BRAINTRUST_PARENT
# environment variable; pass it explicitly to set it in code.
provider.add_span_processor(BraintrustSpanProcessor(parent="project_name:my-otel-project"))
For larger systems, the same instrumentation pattern extends to nested spans, sampling, and distributed traces across services. For the full setup, see the Braintrust guide to instrument tracing.
How Braintrust turns failing traces into regression evals
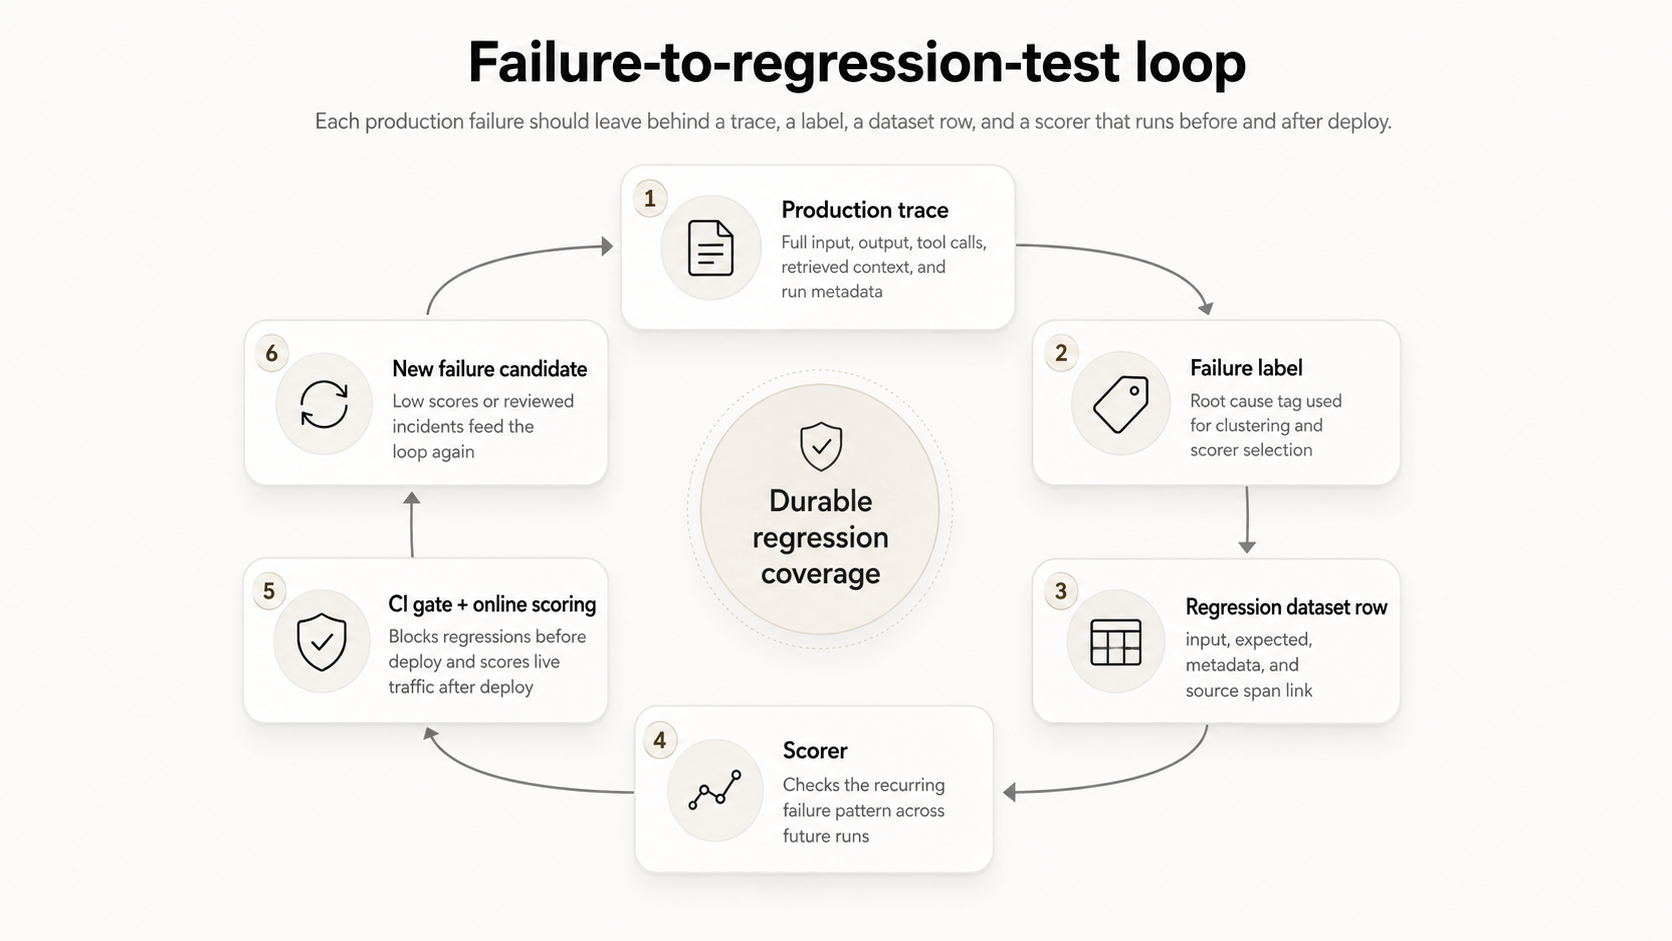
Braintrust integrates a production trace, root-cause label, regression dataset row, scorer, CI gate, and future failure review into a single evaluation workflow.
A trace shows where an agent run failed, but the production value comes from turning the failed run into a permanent evaluation case. In Braintrust, the same production evidence that explains the failure can become part of the regression set used to test future changes to prompts, models, retrieval, or tools.
Step 1. Start with the production trace: Open the failed run and inspect the span tree to find the step whose output caused the wrong result. In the refund example, the retrieval span returned an outdated policy document while the model call reasoned from the retrieved context as expected.
Step 2. Label the failure: Add a root-cause label that describes the failure clearly enough to group similar issues later. A label such as stale policy retrieval is more useful than incorrect answer because it identifies the system behavior that needs to be tested again.
Step 3. Create the regression dataset row: Convert the failed trace into an eval case with the captured input, expected output, metadata, and relevant source span. The production failure then becomes structured test data instead of a one-off debugging note.
Step 4. Attach the right scorer: Use a scorer that checks whether the recurring failure pattern appears again. For retrieval issues, the scorer may check whether the answer uses the right policy context; for tool issues, the scorer may check whether the agent selected the correct tool or passed valid arguments.
Step 5. Run the eval before release: Add the regression case to the evaluation set that runs before deploy. When a prompt, model, retrieval query, or tool definition changes, Braintrust can catch the same failure pattern before the change reaches production.
Step 6. Feed new failures back into the set: Low scores, reviewed production incidents, and recurring patterns that Topics surfaces across all traffic become new candidates for the same process. Over time, production traces become durable regression coverage because each confirmed failure leaves behind a labeled case, a dataset row, and a scorer that runs before and after deploy.
Start free with Braintrust to trace your first agent run and turn production failures into regression evals before the next release.
FAQs: how to trace and debug AI agents in production
How is agent tracing different from observability?
Agent tracing explains one run in depth, while observability helps teams understand behavior across many runs. Tracing is useful when a specific user interaction fails, and the team needs to inspect the execution path. Observability earns its place once teams need dashboards, alerts, online scoring, and review workflows that show whether failures are recurring, increasing, or tied to specific releases. Braintrust takes an active observability approach here. Instead of leaving you to query dashboards, Topics classifies every trace by intent, sentiment, and issue, plus any custom facets you define, so recurring failures surface across all agent traffic rather than only the runs you happen to inspect.
Does tracing add latency or overhead?
Tracing can add some overhead, but production implementations usually keep the impact low by collecting span data outside the main response path. Teams running high-volume agents should use sampling, choose which custom spans to capture, and avoid logging unnecessary payloads. Braintrust supports practical production tracing patterns, including streamed responses and sampled traces, so teams can inspect failures without treating every request as a full debugging session.
Can I trace multi-agent systems?
Multi-agent systems can be traced when each agent call, handoff, tool use, and shared-state update is captured along the execution path. The main requirement is consistent instrumentation across the agents involved in the workflow. With Braintrust, those agent interactions can appear in a connected trace, which makes it easier to review where a handoff changed the task, dropped context, or passed the wrong input forward.
How is agent tracing different from APM tracing?
APM tracing covers infrastructure and service behavior such as request latency, database timing, dependency errors, and service-level failures. Agent tracing captures model-driven behavior, including prompts, tool arguments, retrieved context, intermediate decisions, token usage, and final responses. Engineering teams often need both because APM can show that a service behaved normally, while agent tracing can show that the agent made the wrong decision inside a technically healthy request.