4 best LLM gateways for observability: tracing, cost attribution, and debuggability
An LLM gateway unifies access to multiple model providers, but without observability, teams have no way to trace failures, understand costs, or debug bad responses. Braintrust Gateway combines multi-provider routing with span-level tracing, tag-based cost attribution, and evaluation workflows that help teams catch regressions before they reach users. Start free with Braintrust Gateway.
Why you need an LLM gateway with observability
Your LLM gateway already sits on every request between your application and the model provider, so it already has the core data needed for observability, including the model used, token usage, latency, and response details. Capturing observability data at the gateway layer avoids the extra instrumentation work that teams would otherwise need to add across the application. An LLM gateway with built-in tracing and cost attribution makes production issues easier to understand and fix.
4 best LLM gateways for observability in 2026
Braintrust Gateway
Braintrust Gateway routes LLM model requests to OpenAI, Anthropic, Google, AWS Bedrock, Azure, Mistral, and other AI providers while recording every call as a structured trace in Braintrust's observability and evaluation system. The LLM gateway captures observability data at the routing layer, so developers get full trace details for every request without adding instrumentation code at each call site.
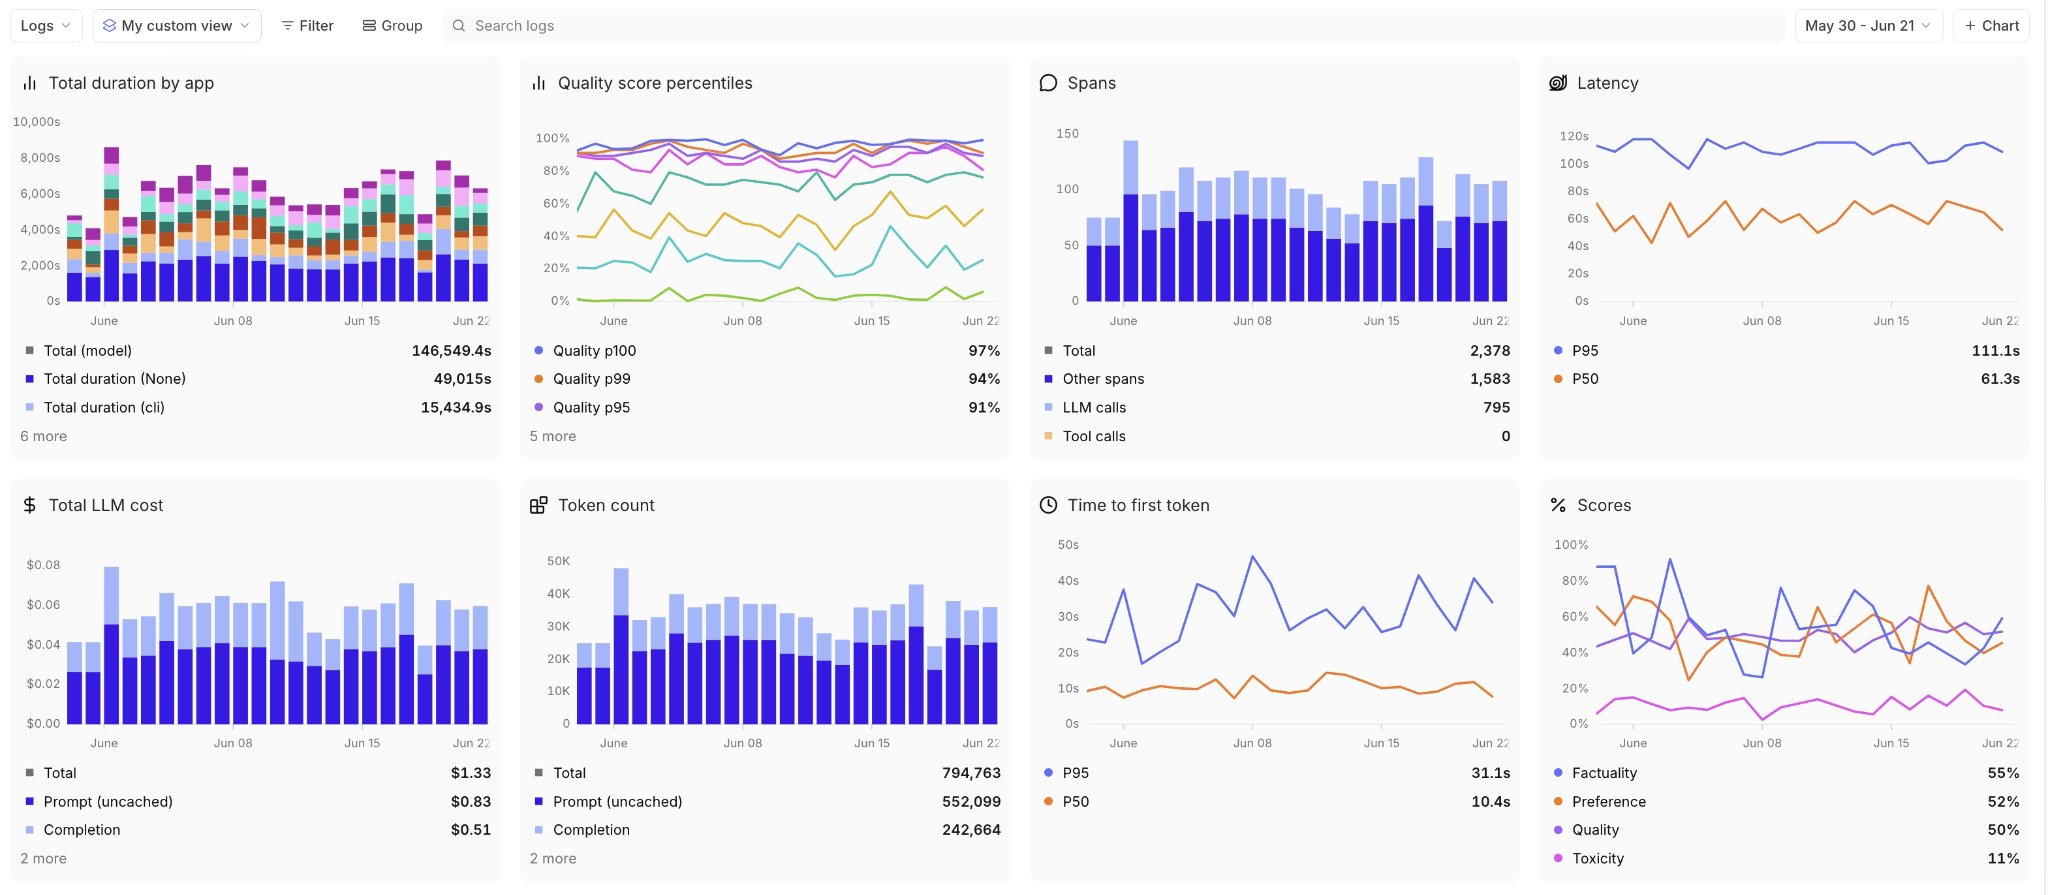
Each captured trace renders as an expandable span tree where every LLM call, tool invocation, and retrieval step appears as its own span with input, output, latency, token count, and estimated cost. The trace format is identical for online and offline evaluation runs, so developers use the same interface whether they are debugging a live issue or reviewing an experiment result.
Braintrust's cost analytics supports custom tags that let teams group spend by user, feature, model, or any other dimension they define. Instead of a single monthly invoice, engineering leads can see when one feature costs significantly more than another and then drill into the specific requests driving that spend.
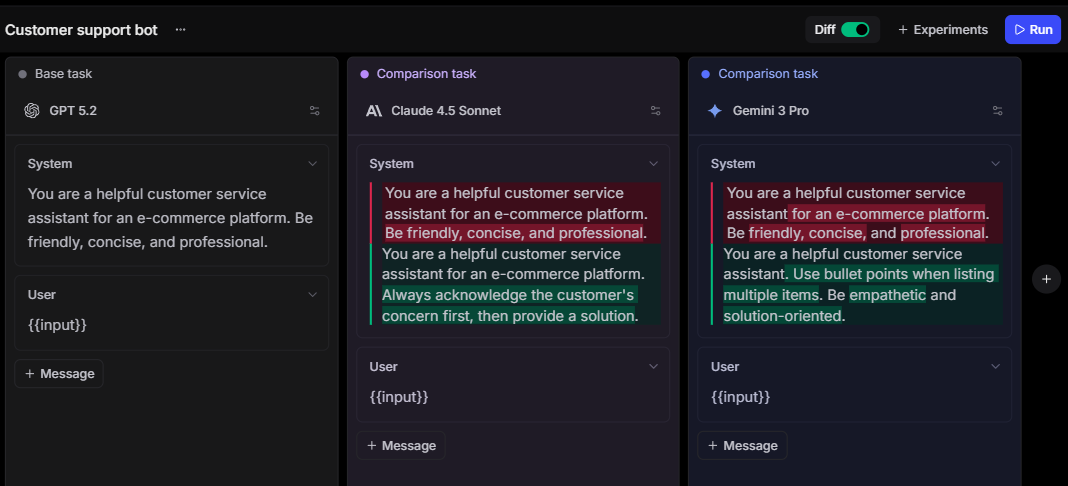
Once a developer identifies a problematic trace, Playground lets them load that trace's prompt and directly test modifications against real production data. The developer can adjust the prompt, swap the model, or change the system instructions, and Playground returns scored results side by side with the original output. Because the results appear immediately, the developer can iterate on a fix without writing a separate test script or leaving Braintrust.
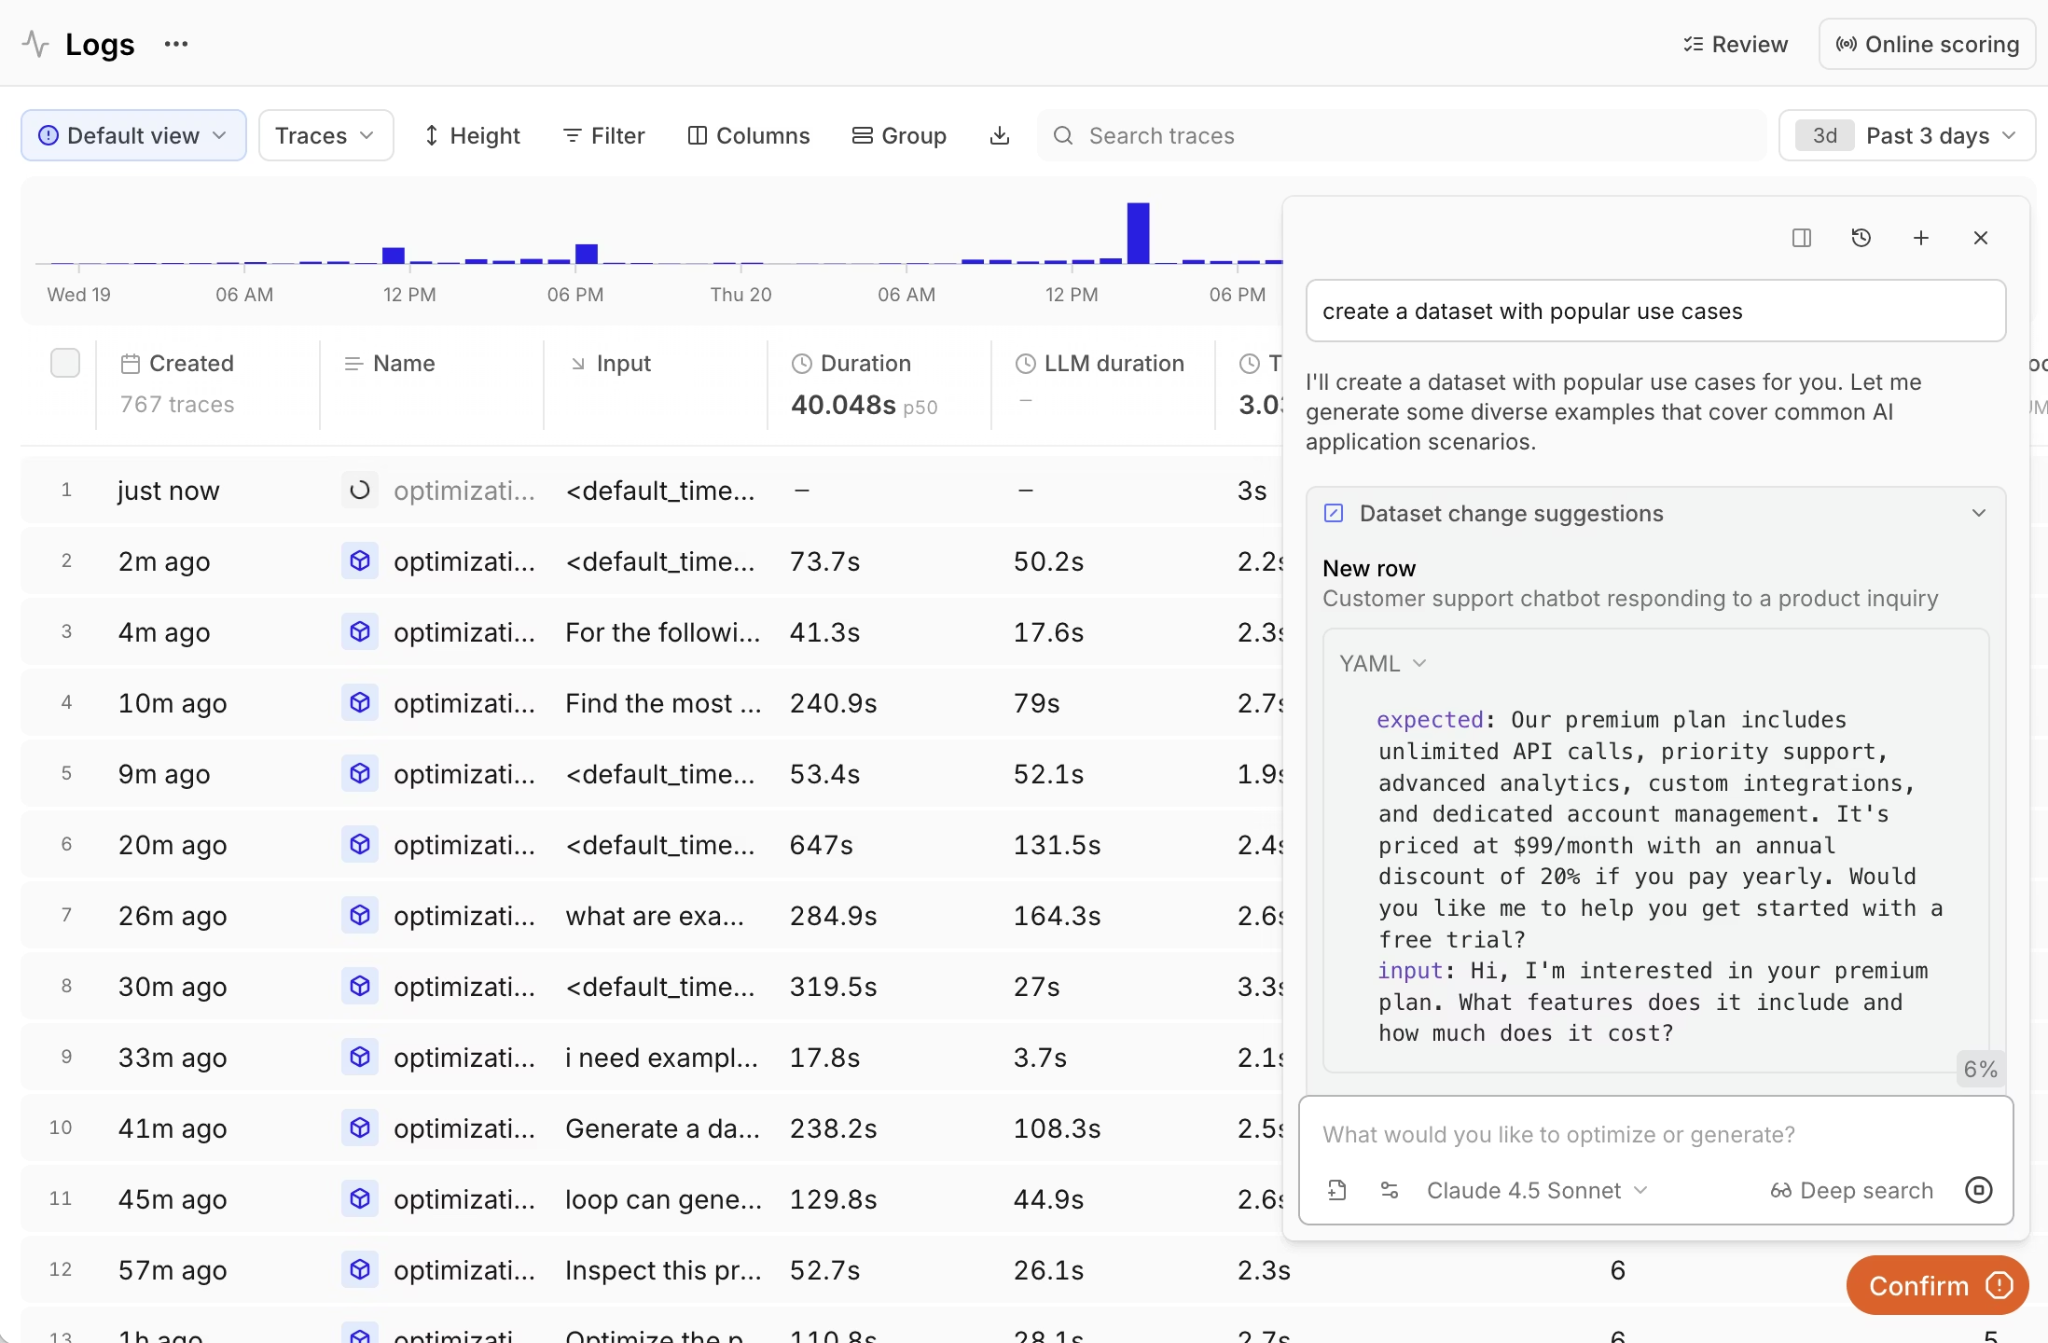
Loop, Braintrust's AI assistant, works on top of production logs to identify patterns that are hard to spot through manual review. Loop can surface clusters of low-scoring responses, flag cost anomalies, and suggest new evaluation metrics based on the data it analyzes. Developers can ask Loop questions in plain language about their production traffic and get answers grounded in actual trace data.
After a fix ships from Playground or a code change lands in a PR, Braintrust's native GitHub Action runs evaluation suites and blocks merges when quality scores drop below defined thresholds. The CI/CD gate tests against the same quality bar that flagged the original issue, so regressions are caught before they reach production.
Braintrust accepts OpenTelemetry spans, converts them into traces with LLM-specific details, and supports 28+ frameworks through its native SDK. Teams already using OTEL for application monitoring can send AI telemetry to Braintrust without changing their current setup.
Best for: Teams that need to trace production LLM behavior, debug issues in a playground with real data, and gate deployments on evaluation scores within the same platform.
Pros:
- Unified API compatible with OpenAI, Anthropic, and Google SDKs with cross-provider model access through a single endpoint
- Nested span trees with per-span cost, latency, token count, and error data for each step in a workflow
- Custom tag-based cost attribution grouped by user, feature, model, or any developer-defined dimension
- Encrypted caching with AES-GCM encryption, configurable TTL, and per-request cache control headers
- Playground loads production traces for direct prompt iteration with scored side-by-side comparisons
- Loop AI analyzes logs to surface quality patterns, cost anomalies, and suggested evaluation metrics
- GitHub Action runs evaluations on every PR and blocks merges when scores drop below thresholds
- 25+ built-in scorers for automated quality evaluation on production traffic with threshold-based alerting
- Supports custom providers and self-hosted models through configurable endpoints
- OpenTelemetry ingestion alongside native integrations for 28+ AI frameworks
- Distributed tracing that nests gateway calls under service spans for full request path visibility
Cons:
- The LLM gateway is currently in beta
- Self-hosting requires an enterprise agreement
Pricing: The LLM gateway is free during beta, with a generous free plan that includes 1 GB of processed data and 10K evaluation scores. See pricing details here.
OpenRouter

OpenRouter gives developers access to 500+ models across 60+ providers and includes a usage dashboard that displays spend per model and per API key. Observability on OpenRouter covers operational billing data and provider-level performance metrics, but it does not provide request-level tracing, scoring, or integration with external monitoring tools such as Braintrust.
Best for: Developers tracking model-level costs and provider performance who do not need request-level tracing or quality evaluation.
Pros:
- Spend tracking per model and per API key through the account dashboard
- Latency and throughput visibility per provider to inform routing decisions
- Unified credit billing simplifies cost monitoring across all providers
- Privacy-focused routing with zero data retention options
Cons:
- No trace-level debugging or span-based request inspection
- No quality scoring, evaluation, or regression detection
- No OpenTelemetry export for integration with monitoring stacks
- Cost breakdowns are limited to the model and API key, with no custom tagging support
Pricing: Prepaid credits with pay-per-token billing. Provider rates passed through. Free models available with rate limits.
LiteLLM
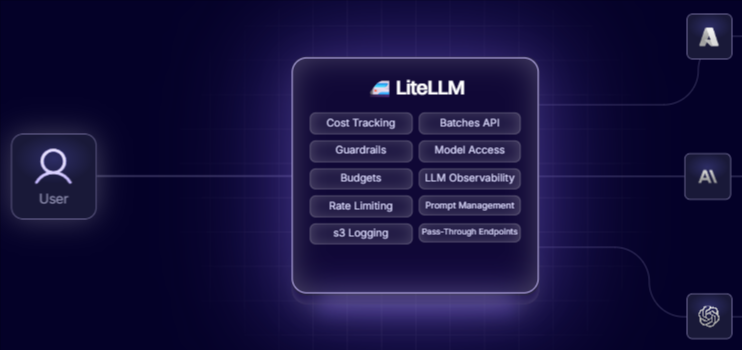
LiteLLM is an open-source Python proxy that normalizes LLM requests into an OpenAI-compatible format and logs spend per virtual key, user, and project. LiteLLM does not ship with a built-in observability interface, but it integrates with full observability platforms like Braintrust.
Best for: Platform engineering teams that self-host their gateway and want to integrate observability data into their preferred monitoring and evaluation tools.
Pros:
- Budget enforcement per virtual key, user, and project, with automatic cutoff when limits are reached
- Log shipping to Braintrust, Langfuse, Datadog, Prometheus, and other observability backends
- OpenTelemetry export is compatible with any OTLP-ingesting tool
- Self-hosted deployment keeps all trace and cost data on the team's own infrastructure
Cons:
- No native trace viewer, dashboard, or alerting system is included with the proxy
- Quality scoring and evaluation require a separate platform like Braintrust
- Redis and PostgreSQL are required for production state management, adding infrastructure maintenance
- SSO, guardrails, and audit logging are locked behind enterprise licensing
Pricing: Free and open-source for self-hosted use. Custom enterprise plans.
Portkey
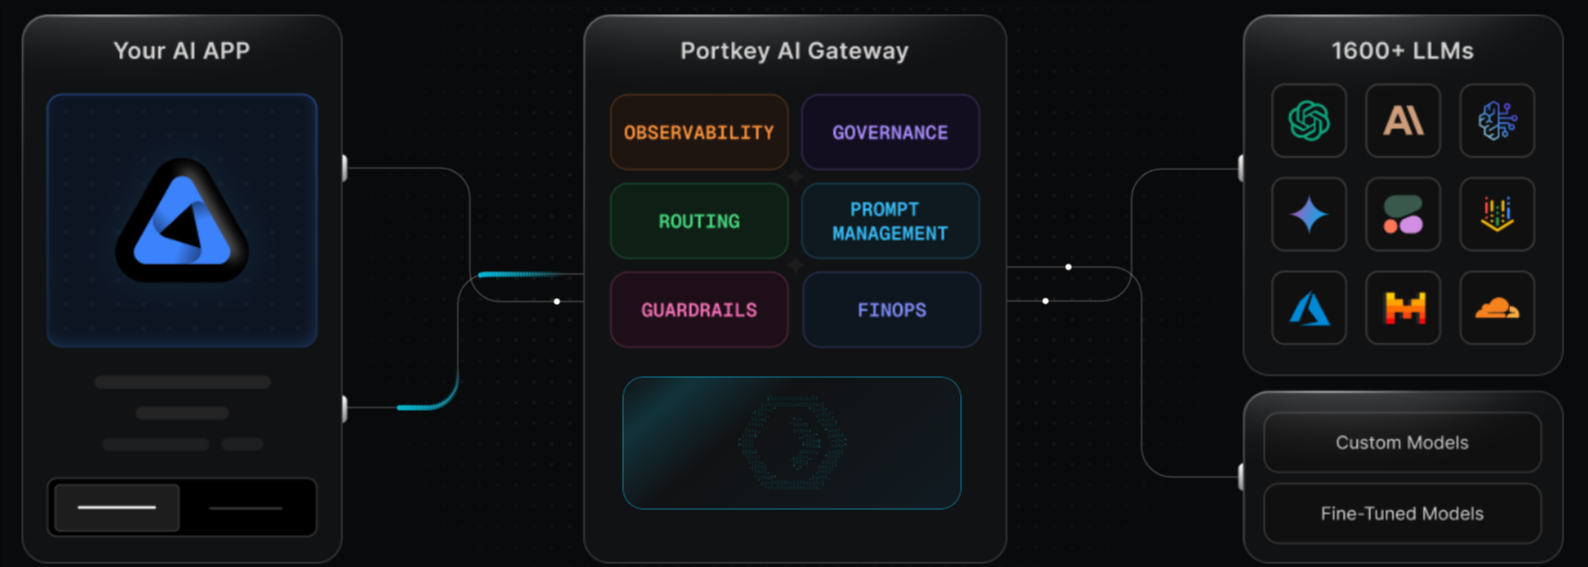
Portkey pairs its AI gateway with an observability module that records 40+ data points per request, covering cost, latency, tokens, caching status, and guardrail results. Portkey also accepts OpenTelemetry data, enabling teams to correlate LLM request traces with application-level telemetry in a single interface.
Best for: Enterprise platform teams operating across multiple LLM providers who need request-level observability combined with governance controls, guardrails, and compliance features.
Pros:
- 40+ data points captured per request with dashboards for real-time filtering and analysis
- OpenTelemetry endpoint for merging application traces with LLM-specific observability
- Cost tracking segmented by workspace, team, and individual user, with budget enforcement
Cons:
- No native evaluation or automated quality scoring in the observability module
- Compliance features, log export, and extended retention require the Enterprise plan
- Log-based billing adds complexity to cost forecasting as request volume increases
Pricing: Free tier with 10K logged requests. Paid plans from $49/month. Enterprise pricing is custom.
LLM gateways for observability compared (2026)
| Tool | Starting price | Trace depth | Cost attribution | Evaluation loop |
|---|---|---|---|---|
| Braintrust Gateway | Free during beta + free tier with 1 GB data and 10K evaluation scores | Nested span trees with per-span cost, latency, token usage, and error detail across production and evaluation | Custom tags by user, feature, project, environment, model, or any custom property | Native. Production traces become evaluation cases with one click, then run through scoring and CI/CD gates |
| OpenRouter | Pay-as-you-go with prepaid credits | Account-level usage dashboard per model and API key | Model and API key level | None |
| LiteLLM | Free and open-source for self-hosted use | Integration to external tracing tools like Braintrust, Langfuse, Datadog, and more | Per-key and per-user budget tracking | Through external platforms |
| Portkey | Free tier with 10K logs | 40+ data points per request with OTEL ingestion | Workspace, team, and user-level segmentation | None natively |
Get full observability on every LLM request with Braintrust. Start free today.
Why Braintrust Gateway offers the most complete observability workflow
Other LLM gateways provide observability through request logs, usage dashboards, or trace exports, but most do not let teams turn production traces into scored evaluations and fix-validation workflows. Braintrust Gateway connects routed requests to tracing, scoring, and evaluation in the same platform, so teams can investigate a production issue, test a prompt or model change against the failing trace, and confirm that the fix improves output quality before shipping.
Top production AI teams at Perplexity, Notion, Vercel, Cloudflare, Stripe, Ramp, and Dropbox use Braintrust to trace, evaluate, and improve model behavior at scale. Braintrust's free tier includes 1 GB of processed data and 10K evaluation scores per month, which gives teams enough room to run observability and evaluation on real production traffic before upgrading. Start using Braintrust Gateway for free to route, trace, score, and evaluate in a single platform.
What to look for in an LLM gateway with observability
Evaluating LLM gateways through the lens of observability means looking past model catalogs and pricing tables. Five capabilities separate an LLM gateway that logs requests from one that actually helps teams debug and improve production AI.
- End-to-end tracing: The gateway should capture the complete execution path for each request, including nested spans for tool calls, retrieval steps, and multi-model chains. Flat request logs do not show which step in a workflow caused a failure.
- Granular cost attribution: Per-request cost tracking is the minimum requirement. Gateways that let teams group costs by user, feature, project, or workflow make it easier to assign budgets and identify the requests driving disproportionate spend.
- Quality scoring on production traffic: Whether the LLM gateway supports automated scoring on live requests through LLM-as-a-judge or custom scorers, turning raw traces into quality signals that trigger alerts before users report problems.
- Evaluation integration: The gateway should let developers turn a production trace into an evaluation case and test a prompt change against it, helping teams move from finding a problem to validating the fix.
- OpenTelemetry support: Teams with existing monitoring stacks need an LLM gateway that exports traces in a standard format. Native OpenTelemetry compatibility ensures LLM observability data fits alongside application-level telemetry without custom adapters.
FAQs: LLM gateways for observability
What is an LLM gateway?
An LLM gateway provides developers with a single integration point to work across multiple model providers. Instead of wiring in separate provider APIs into the application, teams send requests through a single gateway and manage routing, credentials, and provider access from there. Braintrust Gateway goes further by capturing trace and evaluation data alongside each routed request.
What is LLM observability?
LLM observability is the ability to inspect how an AI request behaved in production, including the prompt, model response, token usage, latency, cost, and the intermediate steps that shaped the final output. Braintrust adds structure to that data by organizing requests into traces and making them usable for scoring and evaluation.
Why do I need an LLM gateway with observability?
An LLM gateway with observability gives developers a way to inspect production behavior, understand where a response went wrong, and track cost and quality from the same request path. Braintrust Gateway connects routing to tracing, scoring, and evaluation on a single platform, so teams can investigate failures and confirm improvements without switching between separate tools.
Which is the best LLM gateway with observability?
Braintrust Gateway is the strongest choice for teams that need routing and observability to support the same production workflow. Other gateways can expose logs, usage data, or trace exports, but Braintrust also supports scoring and evaluation from the same request data, which makes it easier to investigate failures and confirm improvements before release.
Which LLM gateway offers the best observability for debugging?
Braintrust Gateway provides the deepest debugging experience because its span-level trace trees let developers investigate each step of a multi-model workflow and view exact inputs, outputs, costs, and errors for each span. The ability to convert any production trace into an evaluation test case and run it against a modified prompt or model makes Braintrust the only gateway where debugging and testing share the same data.