Tracing vs logging for LLM apps: what's the difference and when to use each
Logs record individual events, while traces connect the steps of one request into a span tree. LLM and agent apps often propagate a single answer across retrieval, model calls, tool calls, and post-processing, so teams need traces to see how a specific run produced an incorrect, slow, or expensive response.
Structured logs remain useful because they add step-level detail to spans. Braintrust logs and traces together, then lets teams score the same traces they debug, so production telemetry becomes evaluation data to improve LLM and agent quality over time.
Why logging alone can't explain a failed LLM run
You shipped an agent, added logging across retrieval, model calls, and tool invocations, and now each run produces dozens of entries. A user reports a wrong answer, so you open the log viewer and find entries that look correct in isolation. The retrieval step returned documents, the model received a prompt, and the tool returned a value, but the log stream does not show which step changed the final answer.
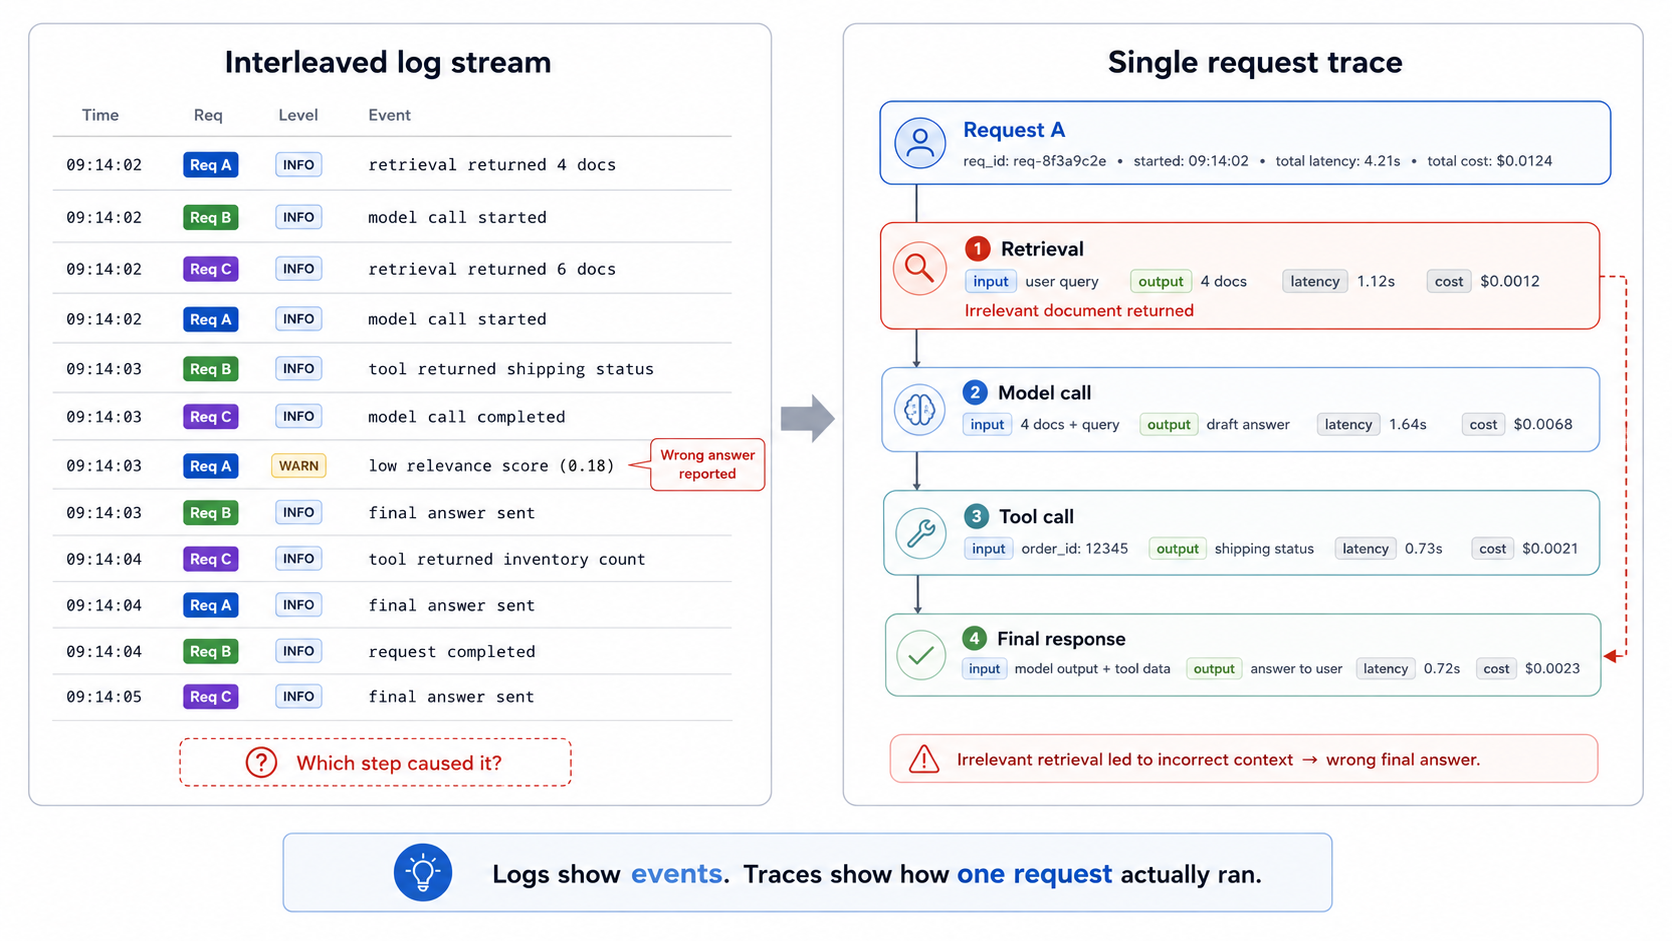
When multiple agents run interleaved in a single log stream, the failure only becomes explainable after the events are connected to a single request path.
A log line is a standalone event with no link to the surrounding steps. Each entry includes a timestamp and a message, but the timestamp does not reliably tie the retrieval, model, tool, and final response events to the same request. When several users hit an agent at the same time, entries from different runs appear in the same stream, which makes the failing run hard to reconstruct by hand.
LLM agents make the debugging problem harder because the same input can follow a different path on the next run. The model can choose a different tool, retrieval can return a different set of documents, and a single request can span multiple model calls before returning an answer. To diagnose a specific failure, engineering teams need the steps of a single run, in execution order, with the input and output of each step attached. Logs capture the individual events, while traces preserve the relationships between those events.
What logging is and where it works well
Logging captures discrete, timestamped events that your system emits as it runs. Each entry records something that happened at a point in time, such as a request arriving, an exception being thrown, a database query completing, or a user authenticating. Unstructured logs use plain-text lines, while structured logs store each field as a key-value pair. Structured logging is the better default for LLM apps because downstream systems can filter, parse, and query each field without having to guess at the format.
Logging supports several operational jobs that sit outside the full path of a single LLM request.
Infrastructure health: When a container restarts, a queue backs up, or a deploy fails, a log line records the event with enough context for an on-call engineer to act.
Error reporting: When code throws an exception, the logs include a stack trace showing the file, function, and line number where the exception occurred.
Audit and security records: When a user accesses data, changes a setting, or triggers a sensitive action, logs provide a durable record for compliance reviews and incident investigations.
For infrastructure, error, and audit workflows, the standalone nature of a log is useful because each event can be understood in isolation. Logging strains when engineering teams need to understand relationships among events. Logs answer what happened at one step, while multi-step LLM runs require a connected view of how retrieval, model calls, tool calls, and final responses shaped the output.
What tracing is and why LLM apps need it
A trace records the connected path of one request as a tree of spans. Each span represents one unit of work inside the request, such as retrieval, a model call, a tool call, or a post-processing step. The span carries the start time, duration, inputs, outputs, and metadata such as model name, token count, and cost. Parent and child spans mirror how the code executed, so engineering teams can read the request from start to finish with every step in context.
LLM and agent apps need tracing because their behavior changes across runs.
Non-deterministic output: The same prompt can produce different text, trigger a different tool, or follow a different branch. The code path alone cannot explain the run, because the model's choices shape the execution path.
Multi-step execution: A user question can trigger planning, retrieval, multiple tool calls, and final synthesis. A failure in any step can change the answer, and a trace shows how the retrieval result, tool output, or model response moved through the request.
Per-step visibility makes tracing useful for debugging and evaluation. Within a trace, teams can inspect the exact prompt sent to a model, the documents returned by retrieval, the latency of each step, and the token cost each span added. When an answer is wrong, slow, or expensive, the trace shows the span that caused the issue.
Tracing vs logging and when to use each
Logging and tracing answer different observability questions in LLM applications, so the right choice depends on whether you need to inspect a single event or reconstruct an entire request path.
| Dimension | Logging | Tracing |
|---|---|---|
| Core unit | A single event emitted by the application or infrastructure. | A full request path made of connected spans. |
| Structure | Independent entries, usually ordered by timestamp. | Parent and child spans that show execution order and step relationships. |
| Best question to answer | What happened at one point in time? | How did one request move through retrieval, model calls, tools, and final response generation? |
| Typical fields | Timestamp, severity, message, service name, error details, and structured key-value fields. | Span name, parent span, start time, duration, inputs, outputs, metadata, token count, cost, and attached events. |
| Request context | Limited unless every log line includes a shared request ID and the backend can reliably group entries. | Built around the request context because every span belongs to the same trace. |
| Debugging fit | Useful for crashes, exceptions, infrastructure faults, deploy failures, and audit events. | Useful for wrong answers, slow responses, expensive runs, poor retrieval, tool failures, and agent path issues. |
| LLM behavior coverage | Weak for non-deterministic and multi-step behavior because each event lacks the full run path. | Strong for non-deterministic and multi-step behavior because the trace shows the exact path a run took. |
| Input and output visibility | Possible when values are logged manually, but log streams rarely preserve step relationships by default. | Native to span-based debugging because each step can carry its input, output, and metadata. |
| Cost and latency visibility | Can record timing or token details for individual events, but end-to-end attribution requires extra correlation work. | Shows latency and token cost per span, then rolls those values up to the full request. |
| Evaluation readiness | Limited because a single event usually lacks enough context to score model or agent behavior. | Strong because retrieval spans, model-call spans, tool spans, and full traces can be scored with the same context used for debugging. |
| Operational use | Infrastructure health, error reporting, audit trails, compliance records, deploy events, and background jobs. | LLM debugging, agent observability, production evaluation, regression analysis, and request-level quality review. |
| Relationship between the two | Structured logs provide useful event detail. | Traces can include structured log fields as span attributes or events, which keep event detail tied to the request that produced it. |
Also read: Logging vs. observability
How Braintrust connects logs, traces, and evaluation
Braintrust connects event details from structured logs, request paths from traces, and quality signals from evaluations into a single workflow.
Attach structured logs to spans: Structured logs become more useful when Braintrust attaches them to the trace that produced them. When a retrieval step records the query, document count, latency, and cache status, Braintrust can keep those fields on the retrieval span instead of leaving the same details in a separate log stream. The trace shows the request path across retrieval, model calls, tool calls, and final response generation, while the structured fields explain what happened inside each step.
Connect events through OpenTelemetry: OpenTelemetry provides the connection layer between logs and traces. It links log records to trace and span identifiers, so Braintrust can show request-level events inside the context of the LLM request that produced them. With instrumentation in place, engineering teams can inspect parent spans, child spans, inputs, outputs, timing, metadata, and attached log events from one trace view. To set up instrumentation for an LLM app, see our guide on instrumenting your app.
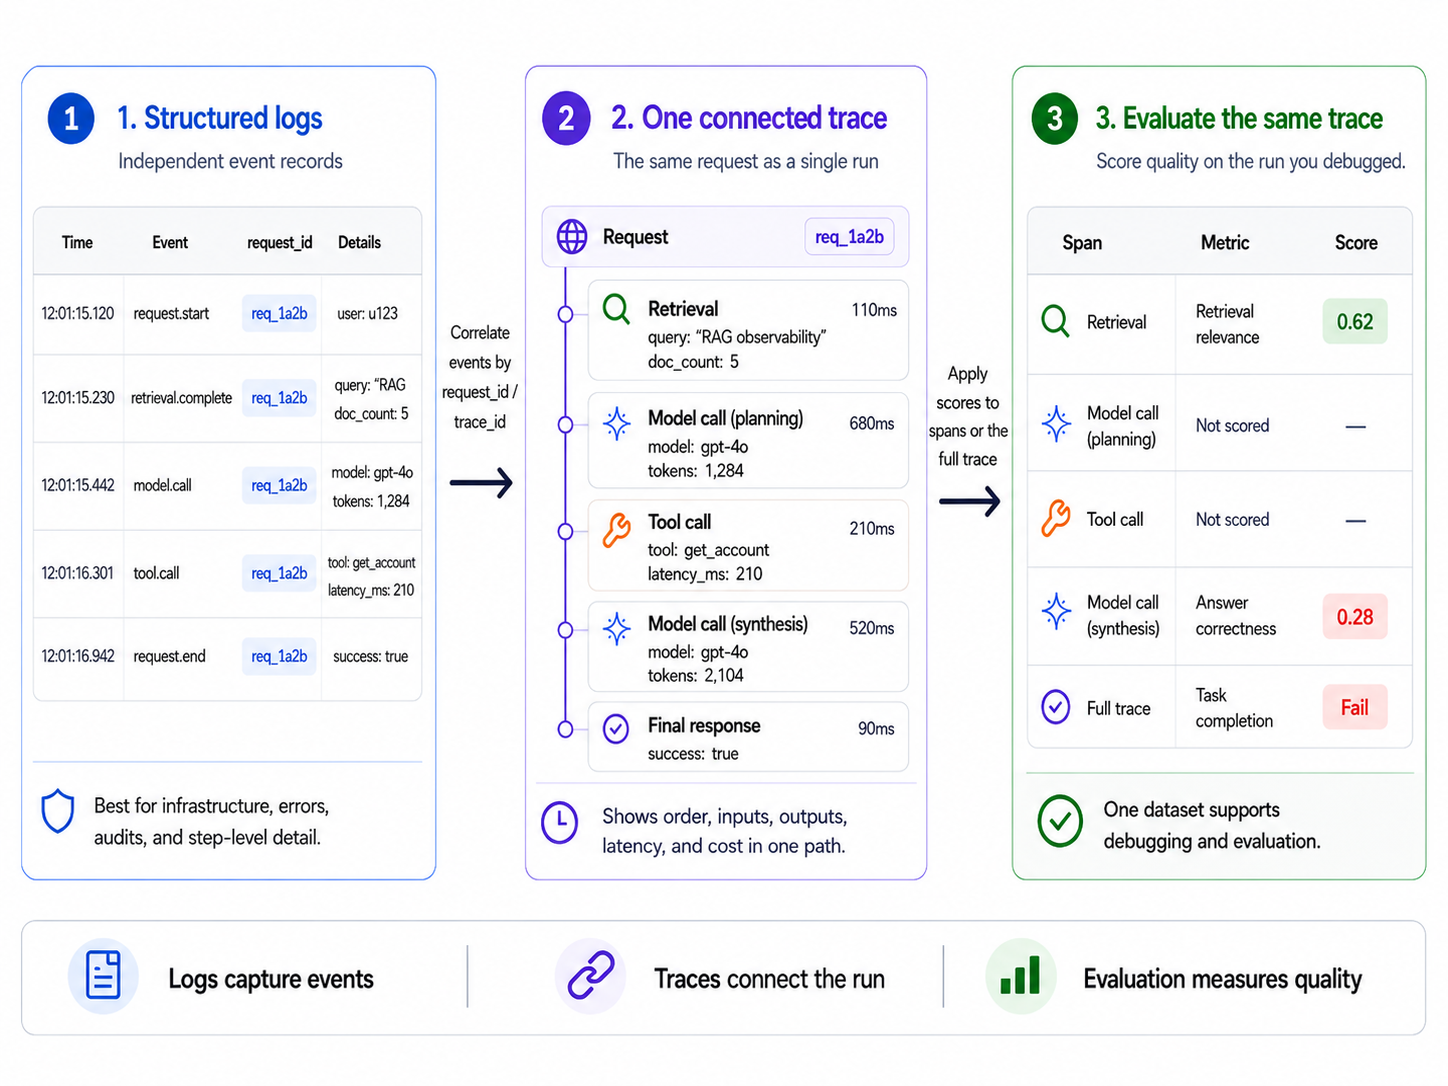
Braintrust keeps structured log fields tied to the spans that produced them, then lets teams score the same traced request for retrieval quality, answer quality, or task completion.
Score traced production behavior: Braintrust turns traced production behavior into evaluation data. Teams can attach scorers to a retrieval span, a model-call span, a tool span, or a full trace, depending on the behavior they need to measure. Retrieval spans can be scored for document relevance, model-call spans for answer quality, and full traces for task completion. To apply scoring to live traffic, see the guide on scoring online. At production volume, scoring every trace is costly and hard to act on, since per-trace scores still leave teams guessing which failures recur. Topics classifies all of them by intent, sentiment, and issue, plus any custom facets you define, surfacing the recurring patterns worth scoring.
Use one record for debugging and evaluation: Keeping logs, traces, and evaluations in Braintrust gives engineering, product, and QA teams one shared record of LLM behavior. A bad answer can be debugged from its trace, scored against the expected behavior, and converted into an evaluation case for future release checks.
Start free with Braintrust, instrument a single endpoint, and connect production debugging to continuous evaluation without copying runs across separate tools.
FAQs: tracing vs logging for LLM apps (2026)
Is tracing a type of logging?
Tracing and logging are separate telemetry signals. Logging records events as they happen, while tracing preserves the request context across the steps that produced a result. In LLM apps, this separation determines whether you can trace a wrong answer back to its cause, since a single response can depend on several calls, tools, and retrieved documents. Logs can be attached to traces, but tracing provides the request-level structure needed to inspect how the response was produced.
Do I still need logs if I have traces?
Logs remain useful for events that do not fit neatly within a single request path, including deployment failures, service restarts, background jobs, access records, and security events. For request-level debugging, structured logs are most useful when attached to spans, where log fields can explain what happened within retrieval, model, and tool steps without requiring engineers to reconstruct context from a separate stream.
How do tracing, logging, and monitoring differ?
Monitoring shows system-level signals such as error rate, latency, traffic volume, and saturation. Logging provides engineers with event-level detail on specific actions or failures. Tracing explains request-level behavior by connecting the steps that produced one result. LLM teams usually need all three because monitoring shows when production behavior changed, logs preserve event detail, and traces explain how a specific model or agent response was produced.
Does OpenTelemetry do both tracing and logging?
OpenTelemetry supports traces, metrics, and logs as separate signals under one instrumentation standard. In practice, OpenTelemetry is often used to link existing log records to trace and span identifiers, so observability backends can show log events within the request context that produced them. For LLM apps, OpenTelemetry can provide the instrumentation layer, while Braintrust gives teams the tracing, logging, and evaluation workflows needed to debug and score production behavior.