> ## Documentation Index
> Fetch the complete documentation index at: https://braintrust.dev/docs/llms.txt
> Use this file to discover all available pages before exploring further.
# Monitor deployments
> Track production performance and errors
Every production request flows through the same observability system you used during development. The Monitor page provides custom dashboards to track performance, costs, errors, and quality metrics across your deployed prompts and functions.
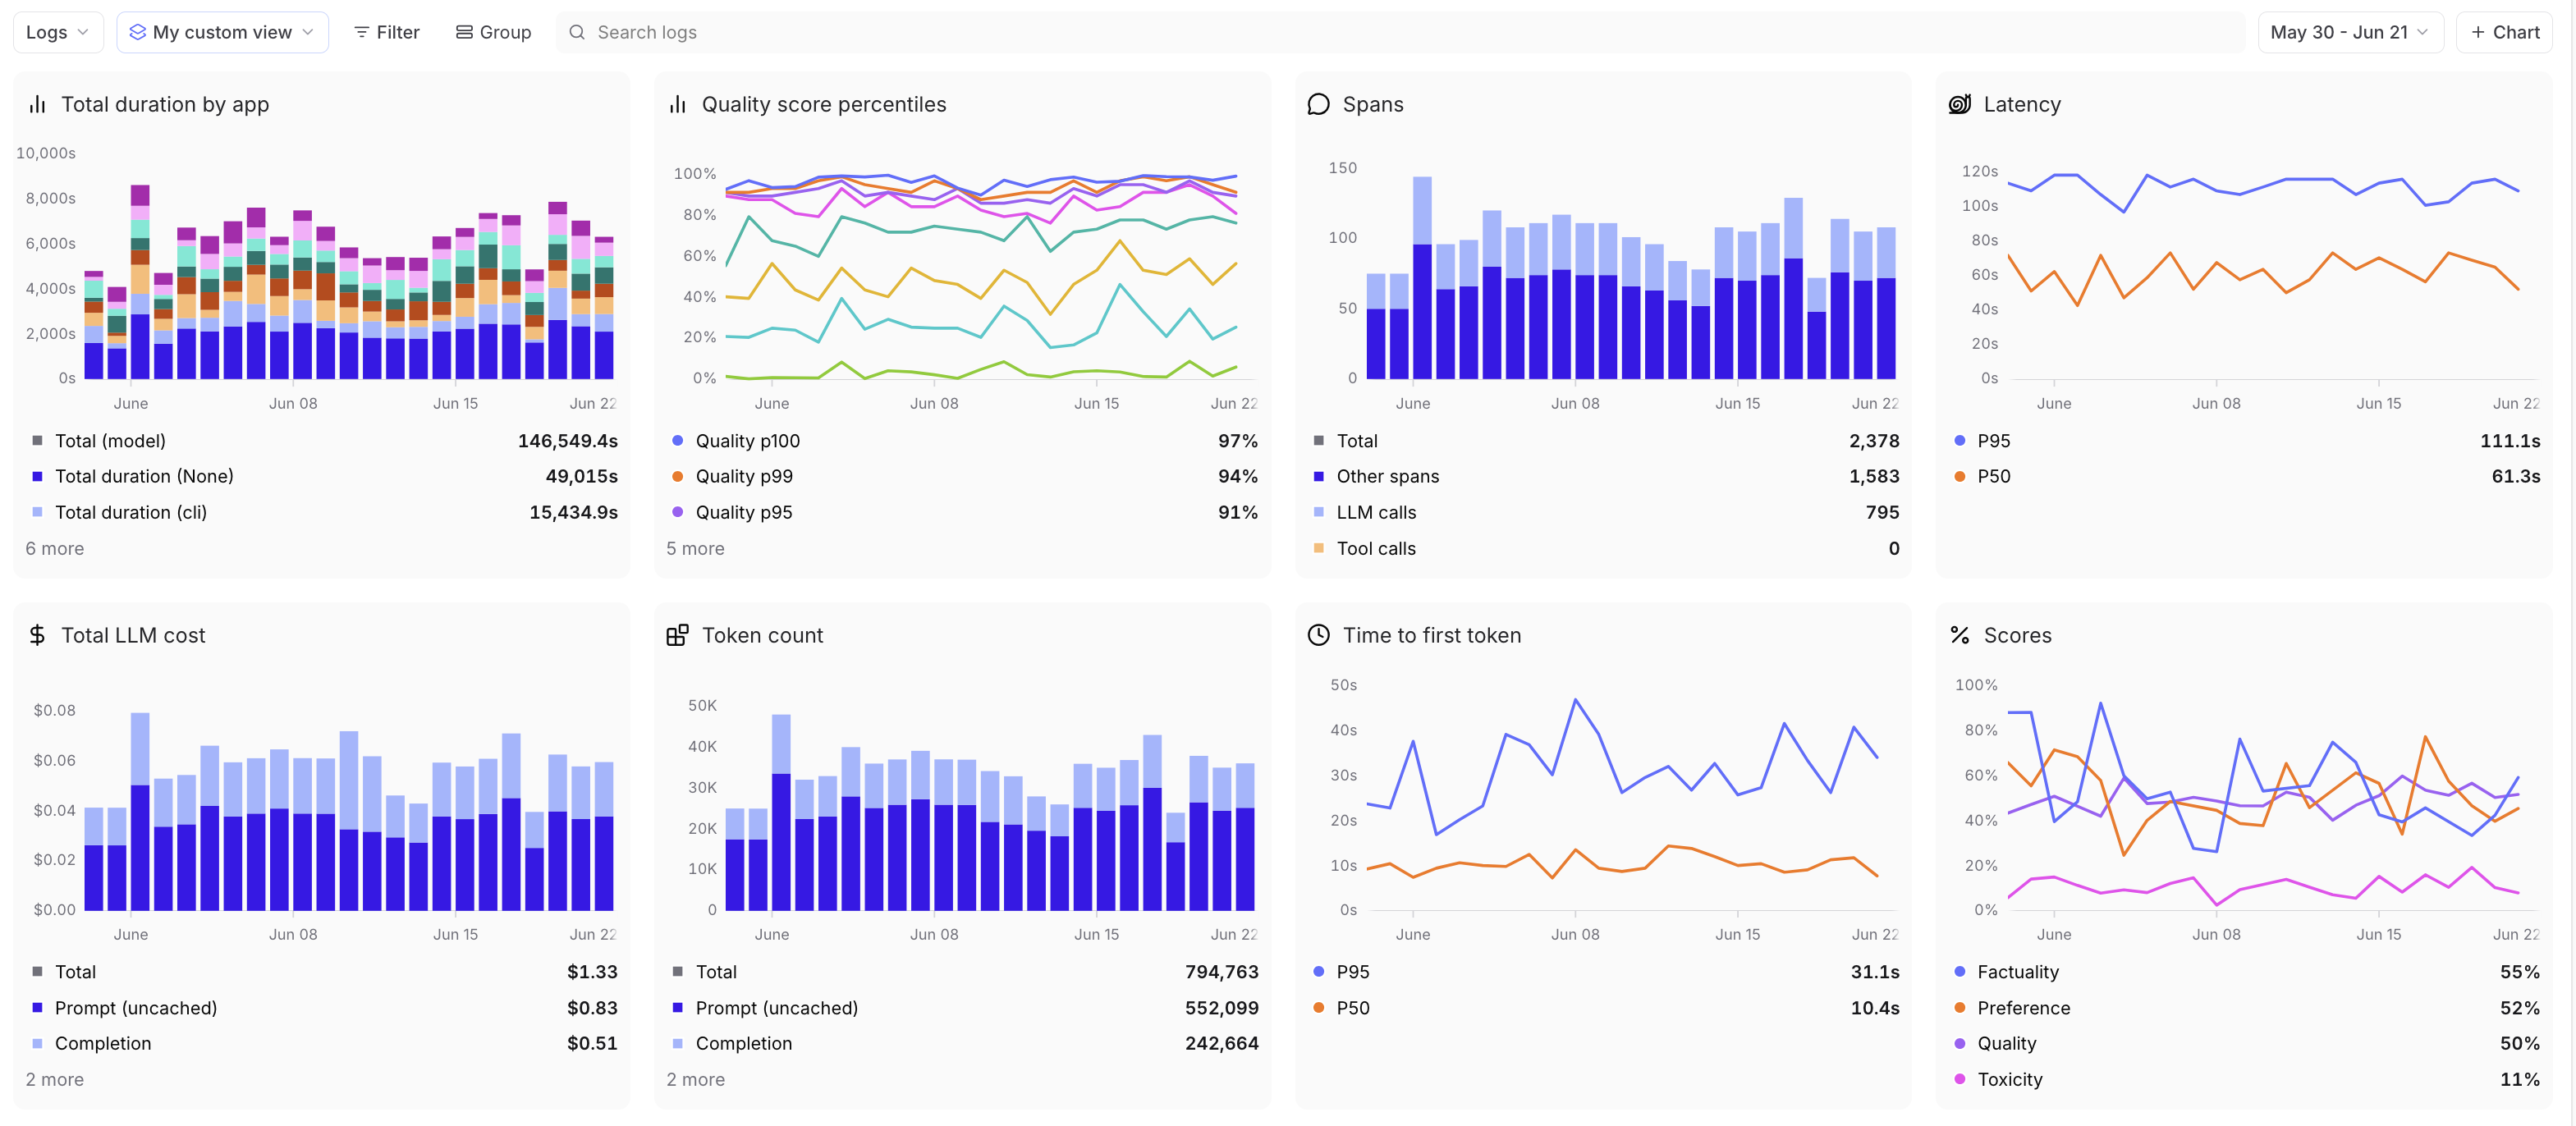
## View production metrics
The [** Monitor**](https://www.braintrust.dev/app/~/monitor) page shows custom dashboards for tracking deployed prompts and functions. For details on creating custom charts, filtering data, selecting timeframes, and configuring dashboards, see [Monitor with dashboards](/observe/dashboards).
Production-specific metrics include:
* **Request count**: Volume of production traffic
* **Latency**: Response time (total duration, time to first token)
* **Token count**: Prompt tokens, completion tokens, and total usage
* **Cost**: Estimated spend based on model pricing
* **Scores**: Quality metrics from online scoring
* **Tools**: Tool call frequency and success rates
Filter by production environments, models, or errors to focus on specific segments. Group by model, environment, user, or custom metadata to analyze patterns across your deployments.
 ## Set up alerts
Configure alerts to notify you when metrics exceed thresholds:
1. Go to ** Settings** > [** Automations**](https://www.braintrust.dev/app/~/configuration/automations)
2. Click **+ Alert**
3. Define your conditions using SQL queries
4. Set notification channels (email, Slack, webhooks)
You can also access and create alerts directly from the ** Monitor** page using the ** Alerts** dropdown in the top right.
Example alerts:
* Error rate exceeds 5% for 10 minutes
* Average latency above 2 seconds
* Daily cost exceeds budget threshold
* Score drops below 0.8
See [Alerts](/admin/automations/alerts) for detailed configuration.
## Track costs
Cost charts estimate spending based on model pricing. Costs are calculated from:
* Token counts (prompt and completion)
* Model pricing rates
* Provider-specific pricing tiers
Cost estimates are approximate. Actual billing from providers may vary based on rate limits, batch discounts, and other factors. [Preset cost charts](/observe/dashboards#create-custom-charts) reflect user-facing requests only - scorer spans generated by Topics and online scoring automations are excluded from these metrics.
## Monitor quality
Online scoring automatically evaluates production requests. View score distributions and trends in the Monitor page:
* Group by score name to compare different quality metrics
* Filter by low scores to find problematic requests
* Track score changes over time to detect quality regressions
Configure online scoring in ** Settings** > [** Automations**](https://www.braintrust.dev/app/~/configuration/automations). See [Score online](/evaluate/score-online) for details.
## Query from the CLI
Use the [`bt` CLI](/reference/cli/quickstart) to query production metrics and browse logs without opening the UI.
Browse production traffic interactively with [`bt view logs`](/reference/cli/view):
```bash theme={"theme":{"light":"github-light","dark":"github-dark-dimmed"}}
bt view logs # Browse logs for the active project
bt view logs --filter "tags INCLUDES 'production'" # Filter to production traffic
bt view logs --window 1h # Last hour only
```
Run metric queries with [`bt sql`](/reference/cli/sql) for scripting and CI pipelines:
```bash theme={"theme":{"light":"github-light","dark":"github-dark-dimmed"}}
bt sql "SELECT avg(metrics.latency), count(*) FROM project_logs('my-project') WHERE created > now() - interval 1 hour"
bt sql "SELECT scores.Factuality, count(*) FROM project_logs('my-project') GROUP BY 1 ORDER BY 1"
```
## Next steps
* [Score online](/evaluate/score-online) to automatically evaluate production requests
* [Set up alerts](/admin/automations/alerts) to catch issues proactively
* [View logs](/observe/view-logs) to investigate specific requests
* [Use dashboards](/observe/dashboards) for detailed observability
## Set up alerts
Configure alerts to notify you when metrics exceed thresholds:
1. Go to ** Settings** > [** Automations**](https://www.braintrust.dev/app/~/configuration/automations)
2. Click **+ Alert**
3. Define your conditions using SQL queries
4. Set notification channels (email, Slack, webhooks)
You can also access and create alerts directly from the ** Monitor** page using the ** Alerts** dropdown in the top right.
Example alerts:
* Error rate exceeds 5% for 10 minutes
* Average latency above 2 seconds
* Daily cost exceeds budget threshold
* Score drops below 0.8
See [Alerts](/admin/automations/alerts) for detailed configuration.
## Track costs
Cost charts estimate spending based on model pricing. Costs are calculated from:
* Token counts (prompt and completion)
* Model pricing rates
* Provider-specific pricing tiers
Cost estimates are approximate. Actual billing from providers may vary based on rate limits, batch discounts, and other factors. [Preset cost charts](/observe/dashboards#create-custom-charts) reflect user-facing requests only - scorer spans generated by Topics and online scoring automations are excluded from these metrics.
## Monitor quality
Online scoring automatically evaluates production requests. View score distributions and trends in the Monitor page:
* Group by score name to compare different quality metrics
* Filter by low scores to find problematic requests
* Track score changes over time to detect quality regressions
Configure online scoring in ** Settings** > [** Automations**](https://www.braintrust.dev/app/~/configuration/automations). See [Score online](/evaluate/score-online) for details.
## Query from the CLI
Use the [`bt` CLI](/reference/cli/quickstart) to query production metrics and browse logs without opening the UI.
Browse production traffic interactively with [`bt view logs`](/reference/cli/view):
```bash theme={"theme":{"light":"github-light","dark":"github-dark-dimmed"}}
bt view logs # Browse logs for the active project
bt view logs --filter "tags INCLUDES 'production'" # Filter to production traffic
bt view logs --window 1h # Last hour only
```
Run metric queries with [`bt sql`](/reference/cli/sql) for scripting and CI pipelines:
```bash theme={"theme":{"light":"github-light","dark":"github-dark-dimmed"}}
bt sql "SELECT avg(metrics.latency), count(*) FROM project_logs('my-project') WHERE created > now() - interval 1 hour"
bt sql "SELECT scores.Factuality, count(*) FROM project_logs('my-project') GROUP BY 1 ORDER BY 1"
```
## Next steps
* [Score online](/evaluate/score-online) to automatically evaluate production requests
* [Set up alerts](/admin/automations/alerts) to catch issues proactively
* [View logs](/observe/view-logs) to investigate specific requests
* [Use dashboards](/observe/dashboards) for detailed observability