Why observe in Braintrust
Observability in Braintrust creates a feedback loop between production and evaluation. Logs use the same data structure as experiments, which means:- Instrumentation code works for both logging and evaluation
- Traces capture identical data in production and testing
- Scores and feedback apply to both logs and experiments
- Production data seamlessly becomes evaluation datasets
View your logs
The Logs page displays all traces from your application in a searchable, filterable table. Each row represents a complete trace with its root span.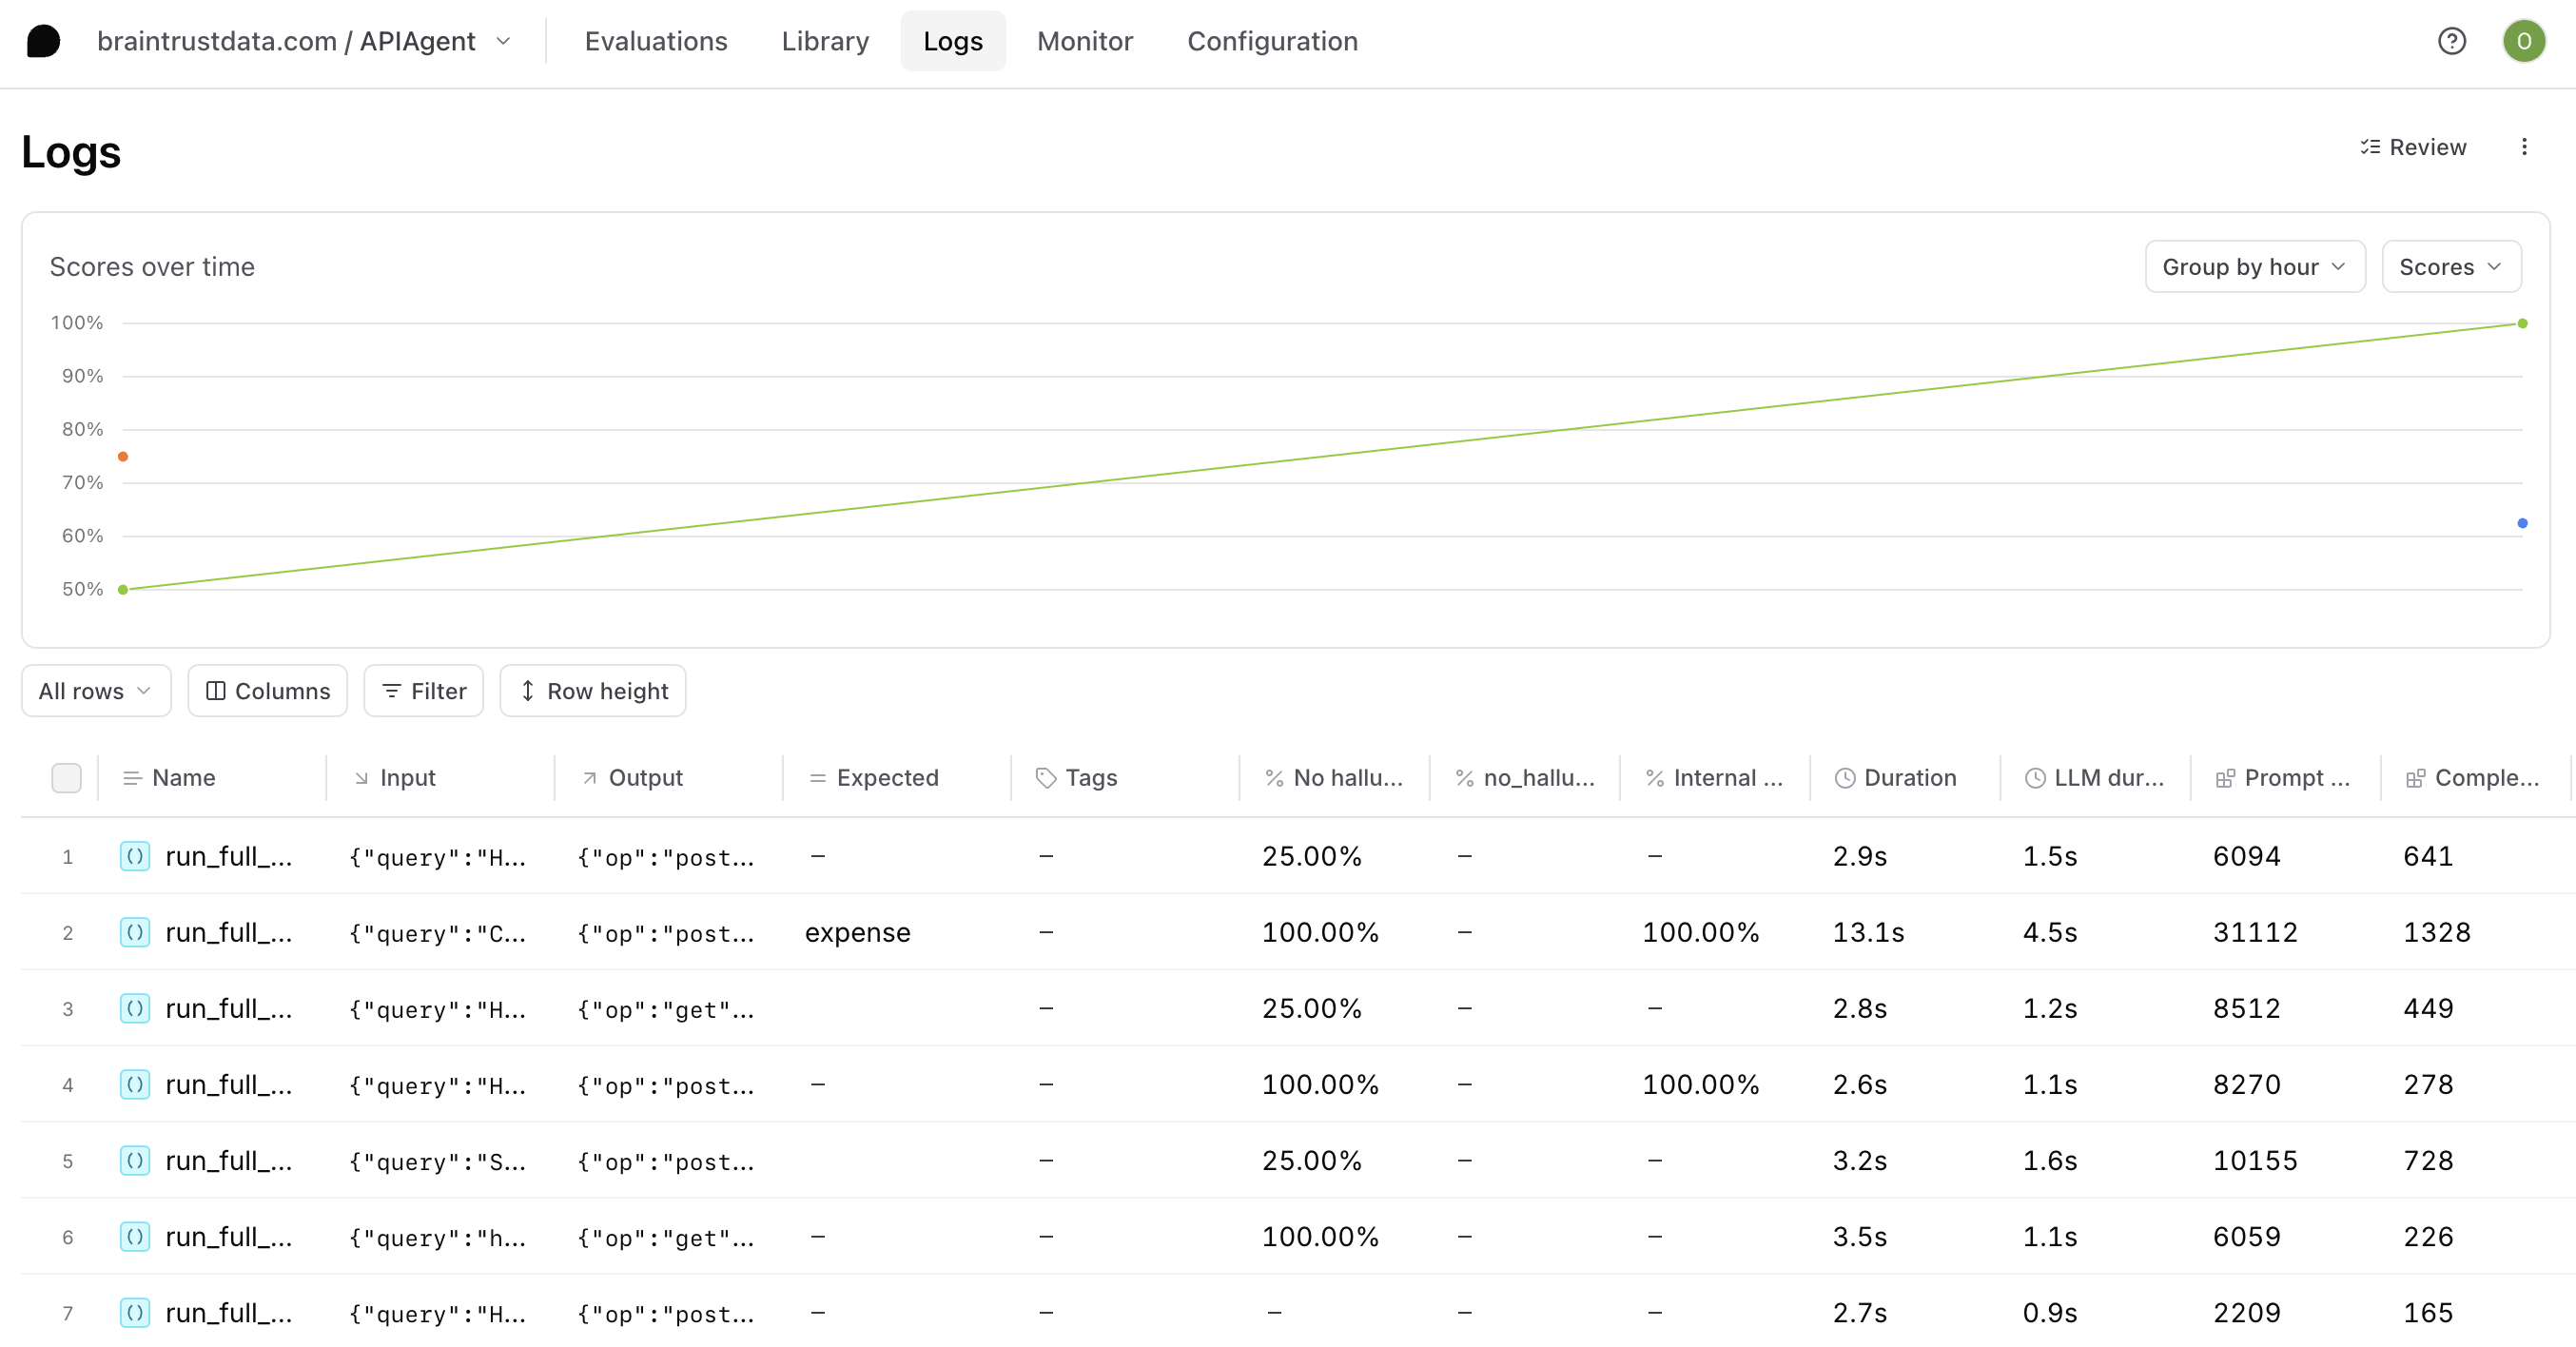
- Browse traces and individual spans, in the UI or from the terminal with
bt view logs. - Group related traces by metadata or tags.
- Create custom columns to surface important values.
- Extract prompts to iterate in playgrounds.
- Apply tags to organize traces.
- Download logs as CSV or JSON, or pull them locally with
bt sync pull.
Discover insights with Topics
Topics automatically analyze and classify your logs to surface patterns without manual review. Each trace is analyzed by facets that extract short labels, then similar labels are clustered into named topics like user intents, sentiment, and issues. Use Topics for:- Blind-spot detection: Surface user request patterns and system gaps you didn’t know to look for.
- Silent failure detection: Catch quality issues that don’t trip explicit checks.
- Product roadmap signals: Cluster real user requests into themes to inform what to build.
- Targeted evaluation datasets: Filter classified logs to build datasets for focused evals.
Filter and search
Find specific traces using multiple approaches:- Filters: Use the Filter menu for point-and-click filtering, or write SQL for precise queries. Apply via the UI, CLI, or API.
- Common filters: Paste ready-made filter patterns for typical queries.
- Saved views: Save useful combinations as custom table views.
- Loop: Ask natural language questions about your logs.
Monitor with dashboards
Custom dashboards aggregate metrics across your logs and experiments. Track request counts, latency, token usage, costs, scores, and custom metrics over time. Dashboards help you:- Visualize trends and anomalies
- Compare performance across time periods
- Drill into specific data points
- Share insights with your team
Use Loop
Loop is Braintrust’s AI agent that understands your data structure and helps you explore logs through natural language. Available on both the Logs page and individual trace pages, Loop lets you ask questions, identify patterns, and get insights without writing queries. See Analyze logs and Analyze individual traces for more details.Next steps
- View your logs in the Braintrust dashboard
- Discover insights with Topics
- Use Loop to analyze logs with natural language
- Filter and search for specific traces
- Score online to evaluate production quality